In this project, I leveraged a combination of Spreadsheet and Tableau to transform raw data into actionable insights, focusing on key aspects of product management and operational efficiency. The visualizations created include:
- Product Timeline:
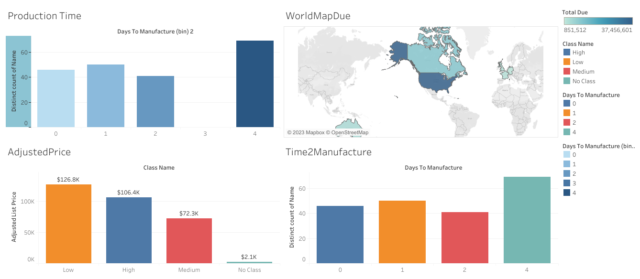
- Description: Developed an interactive “Product Timeline” visualization to chronicle the entire lifecycle of products, offering stakeholders a comprehensive view of their development journey. This tool aids in strategic decision-making by providing insights into each product’s evolution from conception to market release.
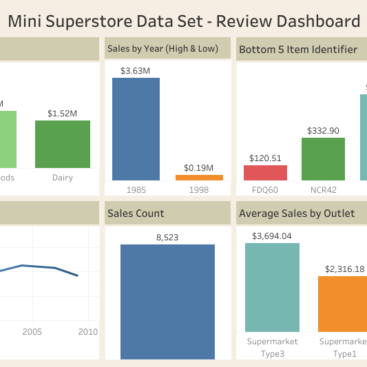
- Adjusted Price Visualization:
- Description: Implemented a dynamic “Adjusted Price” visualization, utilizing Spreadsheet and Tableau to showcase pricing trends and fluctuations over time. This visual representation empowers decision-makers with valuable information for crafting effective pricing strategies and optimizing revenue.
- Time to Manufacture Analysis:
- Description: Conducted an in-depth “Time to Manufacture” analysis, creating visualizations that highlight the duration of the manufacturing process for various products. These visuals identify production bottlenecks and contribute to operational efficiency by streamlining production timelines.
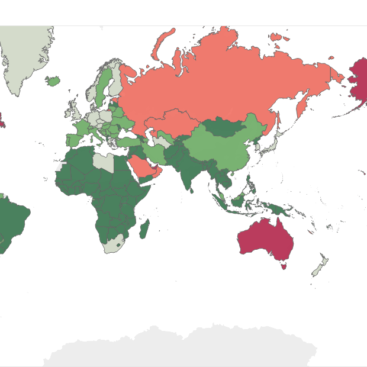
- World Map Due Visuals:
- Description: Crafted engaging “World Map Due” visuals to represent product delivery timelines globally. This geographical perspective helps optimize logistics strategies by identifying regions with efficient supply chains and those that may require improvement.