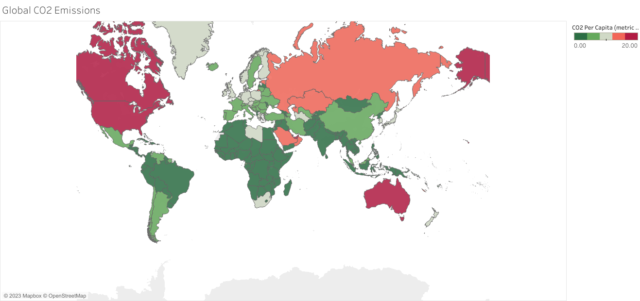
Conducted a comprehensive analysis of global CO2 emissions, utilizing diverse datasets to uncover trends, patterns, and geographical variations. Employed advanced data analysis techniques and powerful visualization tools to communicate complex environmental data in a compelling and informative manner. The project aimed to provide stakeholders, policymakers, and the public with a deep understanding of the dynamics surrounding global carbon emissions.
Key Points:
- Data Collection and Cleaning:
- Gathered diverse datasets related to global CO2 emissions, ensuring data accuracy and consistency.
- Performed data cleaning to handle missing values and inconsistencies.
- Data Analysis:
- Utilized statistical methods and data analysis techniques to derive meaningful insights from the CO2 emission data.
- Investigated trends, correlations, and anomalies in the dataset.
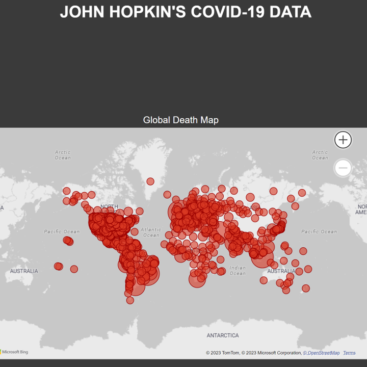
- Geospatial Analysis:
- Employed geospatial analysis to visualize CO2 emissions on a global scale, identifying regions with significant contributions.
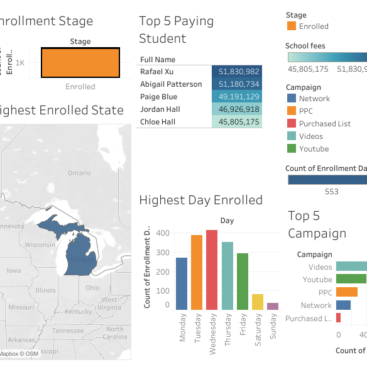
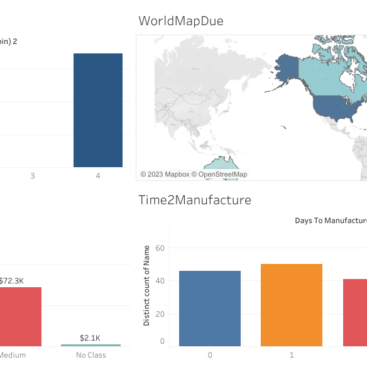
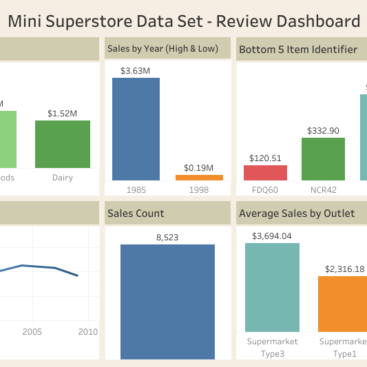
- Data Visualization:
- Developed compelling visualizations using tools such as Tableau or other relevant platforms.
- Created interactive charts and maps to effectively communicate complex environmental data.
- Environmental Awareness:
- Contributed to environmental awareness by highlighting key insights from the analysis.
- Facilitated informed decision-making for policymakers and the public.
- Dashboard Design:
- Designed an interactive dashboard for stakeholders to explore and interact with the CO2 emission data.
- Ensured a user-friendly interface for easy navigation and understanding.